Realtime trend widget
The real- time trend widget can be used to display the changes of value of a tag. Data is not stored in a trend buffer and cannot be retrieved for later analysis.
To display a real-time trend:
- Drag and drop the RealTime Trend widget from the widget gallery to the page.
- Attach the tag that you want to sample to the Curve n Value. Data is always plotted against time.
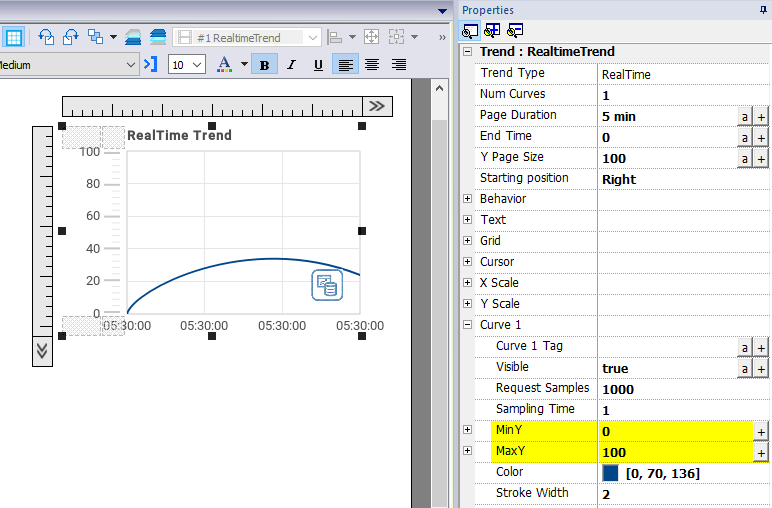
RealTime trend widget properties
| Property | Description |
|---|---|
|
Num Curves |
Number of trend curves to be displayed |
|
Page Duration |
Time window to show |
| End Time |
End time of the time window This parameter can be used to scroll the time window. When zero, the end time is the current system time. |
| Starting Position | Specifies where the curve begin to be drawn when the page is opened (can be left, center or right). |
| Behavior |
Definition of:
|
|
Text |
Trend title and font properties (font size, label, etc.) |
| Grid | Properties of grid presentation (colors) |
| Cursor | Properties of cursor presentation (enable and color) |
| X Scale | Properties of X Scale presentation |
| Y Scale | Properties of Y Scale presentation |
|
Curve "n" |
Tag that will be plotted in the trend widget.
|
Tag values can be scaled using the X Forms in the Attach to dialog. See ""Attach to" parameters" for details.